Why the Household Status of Soldiers in the 5th New Hampshire Matters

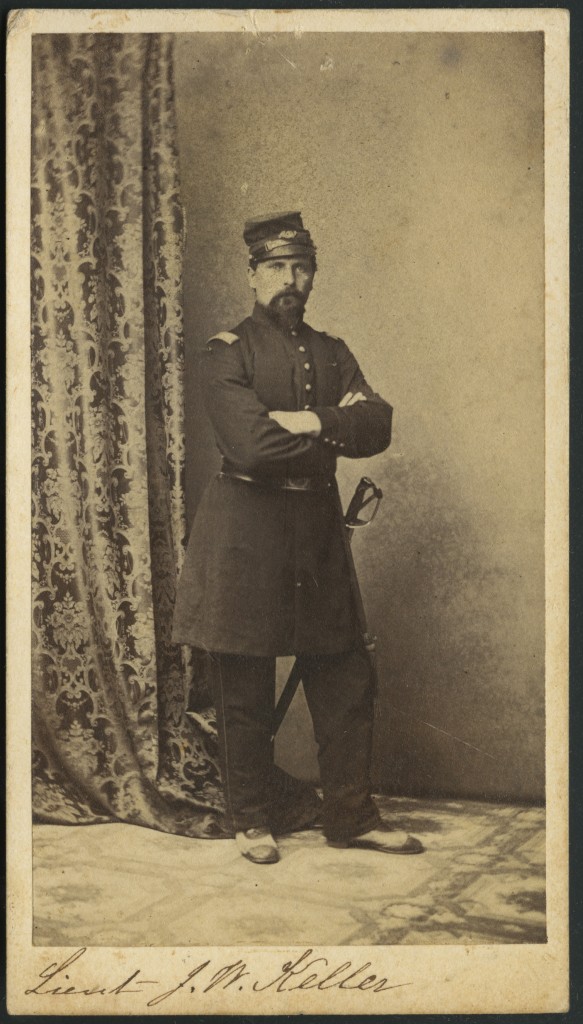
Jonathan C. S. Twitchell (1834-1910): When he enlisted in 1861, Twitchell was a lumberman and millman living in his father’s household in Drummer, NH. At 27 years old, Twitchell was a bit older than most volunteers who still lived at home with their parents. But he was also typical in that his father, Ransom Twitchell, a farmer, had amassed an estate of almost $3000; soldiers who still lived with their parents tended to come from wealthier households. Starting out as a private, Twitchell was eventually appointed Captain of Company K in October 1864. This image shows him with the chevrons of a 1st Sergeant. He served with the 5th New Hampshire until the end of the war and was wounded only once (in the right leg). After the war, he married (1866), moved around a bit, and eventually ended up in Stonehouse, VA, where he worked as a grocer. (This carte de visite and the others displayed in this post are courtesy of David Morin.)

You never know where the data you collect will lead you, and the household status of soldiers in the 5th New Hampshire is a case in point. When I amassed information from the 1860 Census about the people with whom volunteers were living, I never imagined such stark patterns would emerge So, without further ado, let’s go look at the statistics. Yes, I’m afraid there will be lots of numbers in this post.

Varieties of Households

In my pool of 540 soldiers who enlisted in the 5th New Hampshire in September and October 1861, I found the household status of 423 men by using the Census of 1860. The results are below:

  • 155 lived in households headed by their fathers
  • 141 were the heads of their own households
  • 91 lived in households headed by people unrelated to them.
  • 13 lived in households headed by their mothers
  • 11 lived by themselves in various arrangements
  • 9 lived in households headed by their siblings
  • 1 lived in a Shaker community
  • 1 lived in the town poor house
  • 1 lived with his uncle

All of these situations interest me, and I could find something intriguing to say about all of them, but I’d like to focus on the three most common arrangements because they account for 91% of the men in the regiment.

Soldiers Living in Households Headed by Their Fathers (N=155)

Not surprisingly, this group, on average, was the youngest of the three (20.3 years old). The median age was 19. Like the other two groups I’ll be discussing, this one was relatively evenly distributed among all the 5th New Hampshire’s companies (although A and F were a bit on the short side).

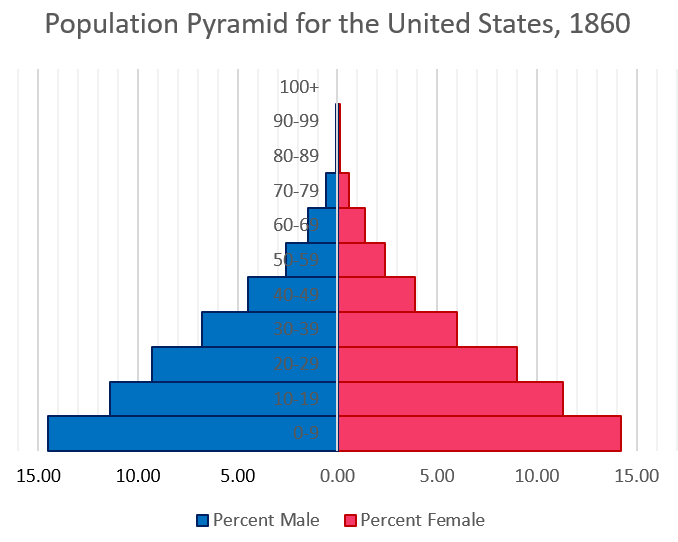
This graph mirrors the overall profile of the regiment (see here). That surprised me somewhat; I would have thought this group would have been even younger since, after all, it was living at home with parents. What is not surprising is the drop off in numbers at 24; it was usually at this point that young men got married and left home.

This was also the wealthiest of the three groups. If we look at the estates of these men’s fathers, we see that they were relatively well-off (for the total value of the estate, I added personal and real estate as indicated by the Census of 1860).  

Farmers dominated among the fathers of these soldiers, making up just over 60% of the group (n=147). The value of most farms fell somewhere between $1500 (which seems to have constituted the minimum for a viable concern) and $4000. The prevalence of skilled labor, white collar workers, professionals, and owners of capital account for the wealth of these men.

  • Farmer: 89
  • Laborer/Farm Laborer/Day Laborer: 18
  • Carpenter: 7
  • Mechanic: 4
  • Physician: 3
  • Lawyer: 3
  • Trader/Merchant: 2
  • Marble Worker: 2
  • Teamster: 2
  • Cordwainer: 2
  • Blacksmith: 2
  • Iron Machinist: 2
  • Mason: 2
  • Millwright: 1
  • Box Maker: 1
  • Iron Manufacturer: 1
  • Shoemaker: 1
  • Painter: 1
  • Joiner 1:
  • Crockery and Looking Glass [Manufacturer]: 1
  • Bridge Builder: 1
  • Real Estate Broker: 1
  • Stone Cutter: 1
  • Miller: 1
  • Tailor 1:
  • Bank Cashier: 1

Keep these numbers in mind as you look at the other groups; the contrast is shocking.  

Thomas Folsom (1827-1863): Folsom was fairly typical of the heads of household who served in the 5th New Hampshire–he was older, married, a father, and man of small means. Born in Gilmanton, NH, whose population had been shrinking for decades, he married Mary Frothingham in 1850. By the time he enlisted, he had a seven-year-old son named George. According to the Census of 1860, Folsom still lived in Gilmanton, working as a day laborer with an estate that totaled $300. He was shot in the thigh at the Battle of Fair Oaks (June 1861) and mortally wounded at Chancellorsville (May 1863), dying three weeks later.

Soldiers Who Were Heads of Households (N=141)

Without looking at the figures, I would have guessed that this group was relatively young (20s and early 30s) with a little bit up capital saved up. And I would have been way off the mark.

The average age of these men was a stunning 34.4 years old.

  • 51 were in their 20s
  • 55 were in their 30s
  • 24 were in their 40s
  • 11 were in their 50s

Men in their 20s, who were probably the best suited for soldiering, formed just over a third of the group. Moreover, on average, the economic prospects of these heads of household did not look terribly good, especially when you consider they had enjoyed ample time to accumulate capital.

I found the value of the estates of 110 of these men, and they look as follows. (Please compare with the fathers of the men who were still living at home in 1860.)

The occupations of this group make it very clear why it was not as wealthy as the fathers of soldiers still living in their parents’ households.

  • Shoemaker: 37
  • Laborer/Farm Laborer/Day Laborer: 36
  • Farmer: 15
  • Factory Operative: 5
  • Machinist: 4
  • Blacksmith: 4
  • House Carpenter: 4
  • Joiner: 3
  • Tailor: 2
  • Cordwainer: 2
  • Brick Mason: 2
  • Coachman: 1
  • Stone Mason: 1
  • Stone Cutter:1
  • Saw Mill Laborer: 1
  • House Painter: 2
  • Shoe Cutter: 1
  • Booking Agent: 1
  • Stage Driver: 1
  • Printer: 1
  • Clergyman: 1
  • Railroad Laborer: 1
  • Music Teacher: 1
  • Ornamental Painter: 1
  • Cabinet Maker: 1
  • Worm Cutter: 1
  • Tanner: 1
  • Peddler: 1
  • Bit and Augur Maker: 1
  • Basket Maker: 1
  • Merchant: 1

Like the soldiers still living in their fathers’ households, this group was fairly evenly distributed among all the regiment’s companies (although they were overrepresented somewhat in A, D, G, and especially the band).

A poor man can be just as patriotic as a wealthy one, but in this case, one wonders if the financial motive for enlisting was somewhat stronger with this group. In the fall of 1861, bounties had not even begun to approach their stratospheric 1863 and 1864 levels. However, a number of these men, who must have suffered from the economic downturn associated with the Panic of 1857, may have thought that the prospects of army life, which included “three squares” a day and $13 per month, were attractive. Certainly, something important must have attracted these men. They left behind wives and children, thereby sacrificing a great deal more by leaving home than their younger, unmarried comrades did.

Henry McGann (1843-1919): Born in Bangor, ME, McGann found himself in Cornish, NH, in 1860, living and working on the farm of Nathaniel Pease, whose total estate amounted to about $2300. This was a common pattern among volunteers who lived in a household headed by someone not related to them; more often than not, these men were farm laborers who lived with their employers. McGann’s service record indicates he was a brave soldier. He was wounded three times–at Fair Oaks (June 1862), Fredericksburg (December 1862), and Farmville (April 1865). A pension payment form from 1888 mentions that he suffered from ““G. s. wds. r. knee & face” [gunshot wounds to the right knee and face]. McGann was appointed Sergeant and re-enlisted in 1864, serving until the end of the war. Here, however, he sports the chevrons of a Corporal. Original volunteers like McGann who later became NCOs seem to have been the glue that held the regiment together in the last 18 months of the conflict, when the rank and file consisted mainly of foreign-born substitutes. After the war, McGann appears to have been involved in the lumber industry for some time. He was married at least three–if not four–times. He ended his days at the New Hampshire Soldier’s Home in Tilton, NH.

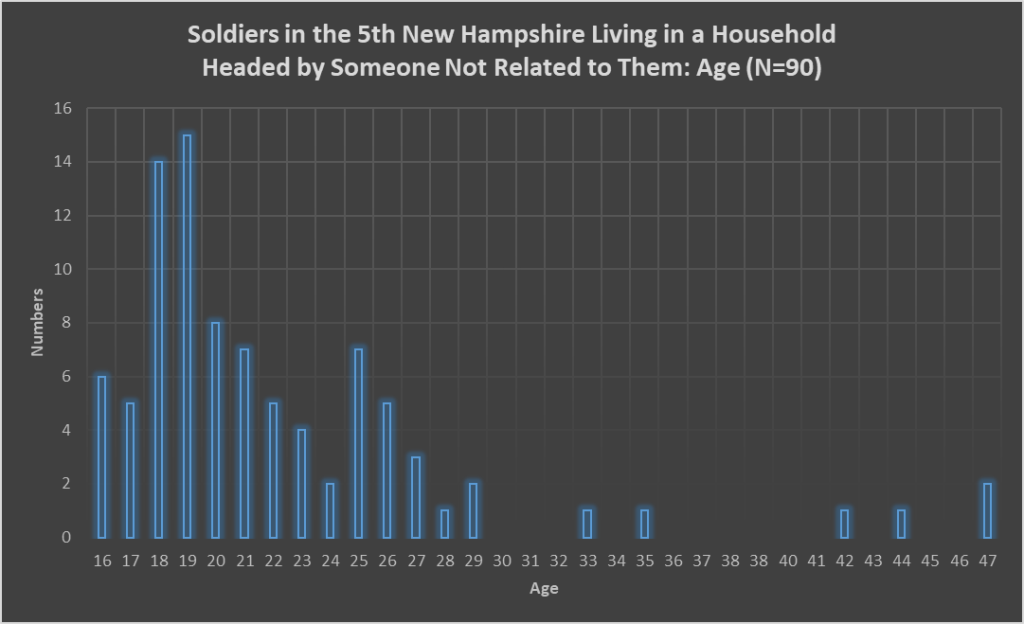
Soldiers Living in Households Headed by Someone Not Related to Them (N=91)

I feel a little diffident making definitive statements about these men for several reasons. First, it’s not always easy to determine if people living in the same household are not related. Second, since these soldiers were not heads of household, I worry that census takers may have overlooked whatever personal property these men had acquired (only nine are listed as owning any property at all). Third, since it’s not clear who their parents were (as opposed to the soldiers who lived with their parents), it’s impossible to establish their class background.

Since these men did not head their own households, they too were fairly young (average age was 22.2 years old, median age was 20). Their age profile, however, is somewhat different from the soldiers who lived in their fathers’ households. This is largely the case because there are a number of older men who were farm laborers who appear to have lived with their employers who were farmers (more about that later).

The age profile is as follows:

I found occupations for 83 of these men. The distribution of occupations is as follows:

  • Farm Laborer: 43
  • Shoemaker: 5
  • Farmer: 4
  • Clerk: 4
  • Cordwainer: 2
  • Physician: 2
  • Carpenter: 2
  • Painter: 2
  • Glass Bottle Converter: 1
  • Teacher: 1
  • Looking Glass Man: 1
  • Millman: 1
  • Machinist: 1
  • Student: 1
  • Mechanic: 1
  • Stone Cutter: 1
  • Sash and Blind Maker: 1
  • Hostler: 1
  • Currier’s Apprentice: 1
  • Weaver: 1
  • Sawing: 1
  • Factory Operative: 1
  • Sailor: 1

Almost all of the laborers appear to have lived with their employers who were farmers. Many of the other men seem to have lived with their employers or boarded with a family for convenience’s sake.

A Final Experiment

For the heck of it, I used a simple measurement to compare the war experience of these three groups. What proportion of them died during the war, and what exactly did they die from? Here’s what I found.

Soldiers Living in Their Father’s Households (n=155):

  • 17 killed in action (11% of total)
  • 5 suffered mortal wounds (3% of total)
  • 21 died of disease (14% of total)

Over a quarter of this group died in the service (28%) with the total evenly split between combat and illness. This was the only group where such was the case; in the others, more men died from combat than disease.

Soldiers Who Were Heads of Household (n=141)

  • 10 killed in action (7%)
  • 10 suffered mortal wounds (7%)
  • 7 died of disease (5%)

Almost a fifth of this group died in the service (19%) with 5% dying of disease and 14% dying in combat. This group suffered an unusually low number of deaths from disease.

Soldiers Living in a Household Headed by Someone Unrelated to Them (n=91)

  • 16 killed in action (21%)
  • 5 suffered mortal wounds (5%)
  • 10 died of disease (11%)

Over a third of this group died in the service (34%) with 11% dying of disease and 26% dying in combat. This group experienced the highest overall mortality, largely because it suffered far more from combat than the other groups.

Each group underwent distinct experiences during the war. Soldiers who were heads of household suffered as much from combat as the soldiers still living in their father’s households but kept their overall mortality down by dying far less frequently from disease. Soldiers living in a household headed by an unrelated person suffered the highest overall mortality largely because over a quarter of them died in combat.

Some of these outcomes seem explainable. For example, it seems possible that the heads of households suffered less from disease because they were older, had been exposed to more illness, and built immunity over the course of their lives.

I don’t know what accounts for some of the other outcomes. Why, for example, were soldiers living in a household headed by someone unrelated to them almost twice twice as likely as other groups to die from combat?

Conclusion

Even though several types of households predominated among our sample, there was a great diversity of living arrangements. But what strikes me even more forcibly, though, is that every almost man, young or old, belonged to a household of one sort or other—either as a member of at its head. The number of men who lived alone in a boarding house or hotel was negligible.

The other fact that makes a great impression on me is that the young men who still lived with their fathers belonged to households that were wealthier than others. Indeed, their fathers seemed like the type of men who hired men from the other two types of households that predominated among the men who volunteered for the 5th New Hampshire.

Without a doubt, New Hampshire had its rich, middling, and poor people, and in return for a wage, some men worked for others. But it seems possible to exaggerate class differences during this period.

What perhaps mitigated these differences was that many owners of property still worked with their hands. Even though they all owned capital, the farmer on his land, the carpenter in his shop, and the blacksmith at his forge lived by the sweat of their brow. Indeed, most of the men who volunteered for the 5th New Hampshire were unfamiliar with the class relations we associate with modern industrial capitalism. True, by 1861, the factory system had reached New Hampshire, but operatives in the mills of small towns that dotted the countryside still mainly consisted of young women. Moreover, the smattering of iron molders, file cutters, and machinists who joined the 5th New Hampshire were highly skilled craftsmen who probably did not conceive of themselves as forming part of an urban proletariat.

Since these groups differed substantially in a number of ways (e.g. age, wealth, etc.), it should probably come as no surprise that their experiences of the war differed. At this point, though, I’m not prepared to explain exactly how and why. That’s a topic for another post.

“New Hampshire is a Good State to Emigrate From”: State Demography and the 5th New Hampshire

Jacob Keller (1827-?): Keller emigrated from Germany to the United States in 1855. He settled in Claremont, NH, where he worked on the farm of Charles F. Long, father of Charles H. Long who later commanded Company G of the 5th New Hampshire Volunteer Infantry. At some point before the war, Keller moved to Boston where he was employed as a machinist. After a brief stint in the 6th Massachusetts Militia Regiment, Keller returned to Claremont, NH, and became the 1st Lieutenant of Company G of the 5th New Hampshire. Keller traveled farther than most to reach Claremont, but he was part of an important demographic trend in New Hampshire at the time. While the population in small, rural towns stagnated as large numbers of folks left the state, people from the New Hampshire countryside, neighboring states, and other countries increasingly migrated to the state’s urban areas.

The Census of 1860 and Demographic Trends in New Hampshire

Why should somebody studying the 5th New Hampshire Volunteer Infantry show any interest in New Hampshire’s demography on the eve of the Civil War?

First, and most important, military units are an expression of the society that produces them, and society is fundamentally influenced by demography. By studying the demographic changes that New Hampshire experienced during the Civil War period, then, I thought I could better understand the background of the men who made up the regiment. Second, by studying this topic, I hoped to learn more about the nature of the strain that the war imposed on the state during and after the conflict.

In looking at the Census of 1860, one is immediately struck by the slow growth of New Hampshire’s population over the previous decade. While the number of people in the United States as a whole had grown by 35.6% during the 1850s (with the white population expanding by 38%), the corresponding figure for New Hampshire was 2.5%. In fact the census specifically pointed out that the only state whose population grew less than New Hampshire over this period was Vermont (0.3%).[i] Other figures that appear in the introduction to the census indicate that New Hampshire bore other hallmarks of a slow-growing state. The birth rate, as calculated by the census, was 2.05%, well below the 2.90% that was the national average for whites in the United States.[ii] Having fallen from 5.55 in 1850 to 4.94 in 1860, the number of people per dwelling in New Hampshire was far below the national average of 5.95 (although I’m not quite sure what exactly that number signifies).[iii] In other categories, New Hampshire did not seem to be a big outlier. New Hampshire’s marriage rate (0.79%) and death rate (1.39 per hundred) did not seem totally out of whack with the rest of the country (0.82% and 1.28 per hundred, respectively).[iv]

Interrogating the figures for the state more deeply does reveal some interesting phenomena. Not surprisingly, New Hampshire was older than the rest of the United States. Some population pyramids comparing the two make this point clear.

Unfortunately, the different scales actually dampen the big differences between the two graphs. What stands out, though, is that proportionally speaking, the United States had more males in the 0-9, 10-19, 20-29, and 30-39 age groups than New Hampshire—while New Hampshire had more males than the United States did in all the older age groups.[v]

At the same time, another outstanding fact is that New Hampshire, proportionately, had more women than the United States did, except in the 0-9 and 10-19 age groups. Moreover, overall, New Hampshire had more females than males (50.9% versus 49.1%), something that was unusual in a country where men outnumbered women (but not unusual in New England where states like Massachusetts also had more women than men).

And yet, in some respects, New Hampshire matched up fairly well with some national averages. For example, 19.5% of New Hampshire’s population consisted of men at “the military ages” (18 to 45)—somewhat above the national average of 17.9%.[vi] One cannot avoid the suspicion, though, that the age distribution within this group tended to skew older in New Hampshire than many other places. It may also have been the case that men on the older end of this range were of dubious value since they were less likely to volunteer or bear the rigors of campaigning. And if that was the case, the proportion of men in New Hampshire who were truly capable of military service was probably smaller than that of other states.[vii]

The proportion of New Hampshire’s population that lived in urban areas was very close to the national average. I define “urban” as an incorporated area with a population of at least 2,500 people. Yes, I know that 2,500 is a small number. And yes, I know that the Census of 1860 did not actually employ any standard for measuring urban areas. However, it is worth pointing out that starting as early as 1880, the census bureau began wrestling with how to define such areas, and it started labeling incorporated areas of 2,500 or more as “urban” in 1910.[viii] So let us use this this measurement and see where it takes us.

By this low standard, New Hampshire only possessed 12 urban areas in 1860 (all figures come from the Census of 1860).[ix]

  • Manchester 20,068
  • Concord 10,867
  • Nashua 10,043
  • Portsmouth 9,306
  • Dover 8,487
  • Somersworth 4,785
  • Keene 4,317
  • Claremont 4,009
  • Rochester 3,833
  • Exeter 3,265
  • Gilford 2,809
  • Sanbornton 2,743

According to these figures, then, 84,532 of the state’s 326,073 people lived in urban areas, or 26%. That is somewhat higher than the percentage for the United States as a whole (20%).[x] While more of its population lived in urban areas than, say, Vermont and Maine, New Hampshire’s average fell far below that of New England as a whole (36%) and its neighbor to the south, Massachusetts (60%). We should also keep in mind that much of New Hampshire’s urban population lived in what were then considered fairly small towns. Only three of them appeared on the list of America’s 100 largest settlements in 1860: Manchester (44th), Concord (86th), and Nashua (91st).

Large towns should be of especial interest to us because they added to their populations far more rapidly than the state as a whole. The three towns listed above grew at astounding rates in the 1850s:

  • Nashua: 73%
  • Manchester: 44%
  • Concord: 27%

These three urban areas far outpaced all other settlements in New Hampshire. The fastest growing county in the state, Coos, which amounted to New Hampshire’s last frontier, grew by only 11% during the 1850s—much slower than these large towns and the national average. Even Hillsborough County, where Nashua and Manchester were located, only grew by 8% as a whole. Clearly, these urban areas were the only parts of the state that experienced high population growth.

Growth in urban areas was generated largely by migration from three sources: people from smaller towns within the state, people from other states, and people from other countries. During this period, Americans were highly mobile, so none of this should surprise us. Migration, however, also explains the stagnation of the state’s rural population. In other words, at the same time that people moved to the state’s largest urban areas, large numbers also left the state. According to the Census of 1860, 382,521 living Americans had been born in New Hampshire but only 256,982 of these people had remained in the state. That means 125,539 people, or almost a third of those born in the state, had left (the most frequent destinations appear to have been Massachusetts, Vermont, New York, and Maine—in other words, all of New Hampshire’s close neighbors). These departures were only partially compensated for by arrivals from other states (48,032) and countries (20,938). The net loss due to migration was 56,569.[xi] The most striking fact that emerges from the census in this context is that New Hampshire had a very low number of foreign-born residents for a free state (6.42% of the population). Among such states, only Maine had a lower proportion (5.96%). Indeed, in this category, New Hampshire’s profile resembled that of the slave states whose percentages ranged from 0.33% in North Carolina to 7.19% in Texas.[xii]

What these figures seem to suggest is that while New Hampshire lost a great deal through emigration, it did not gain quite as much from immigration. Well might Daniel Webster have claimed (and I know the following quote is apocryphal) that “New Hampshire is a good state to emigrate from.”[xiii]

To summarize, New Hampshire was characterized by extremely slow population growth before the Civil War. Low birth rates probably played an important role in this process. At the same time, however, migration not only made a decisive contribution to the state’s demographic stagnation but also determined which parts of the state grew faster than others. A substantial number of folks who grew up in small-town New Hampshire either moved to urban areas or left the state. Immigration from neighboring states and foreign countries also augmented the growth of these urban areas. While large towns grew, small towns’ populations remained stationary. Overall, the number of people in New Hampshire barely grew at all during the 1850s. Immigration from other states and countries could not fully compensate for the number of emigrants who generally headed to nearby parts of New England. What remained was a population that that was older than the national average with a higher proportion of women.

During the war, the Federal government determined the recruitment quota of each state simply by its population. Unlike most other states, New Hampshire had more women than men and was older, on average, so it would have experienced greater difficulty in reaching its recruiting targets. Not only that, death, maiming, and sickness among its young men would have exerted a disproportionate influence.

Demographic Trends and the 5th New Hampshire: The Importance of Migration

The overall profile of the men who enlisted in the regiment in September and October 1861 fits very nicely with the demographic trends we’ve explored thus far. Of course, the figures varied from company to company, but the regimental-wide averages well reflect what was happening in New Hampshire.

Out of the pool of 540 original volunteers that I studied, 36% (194) lived in 1861 where they’d been born. Considering what I’ve asserted about migration thus far, that might seem like a high figure, but if I had to guess, I’d attribute that number to the youth of the group. Many recruits still lived in their parents’ households, and that often meant living in the town of their birth (almost 59% of the regiment was under the age of 25, and on average, men at the time tended to get married just shy of their mid-twenties).

The numbers reveal that despite the extent of migration and the rapid growth of urban areas, the state was still largely rural. That meant the great majority of original volunteers in the 5th New Hampshire were from small towns.

  • 31% (160) had been born in the state and resided in the small town that had been their birthplace
  • 20% (106) had been born in the state but found themselves in a different small town than the one in which they’d been born
  • 16% (87) had been born out of state—most frequently in Vermont or Maine—and moved to a small town in New Hampshire
  • 4% (23) of foreign-born recruits moved to a small town in the state

In other words, 57% (216 out of 376) of the recruits living in any given small town in New Hampshire had been born somewhere else.

These figures should remind us that small settlements in New Hampshire witnessed a fair amount of turnover during this period . The degree to which small-town New Hampshire’s population stagnated even as it witnessed this turnover is evident from the following graphs. (As you look at these graphs, keep in mind that the population of the United States grew by about 230% between 1820 and 1860.)

Among the towns from which the 5th New Hampshire was recruited, only the following doubled in size (or more) between 1820 and 1860: Concord, Claremont, Dover, and Littleton (barely).

Twenty-three percent of the pool lived in urban areas (as opposed to 26% of the state’s population as a whole). Urbanites were concentrated in only a few companies: Claremont (Company G), Concord (Company A), and the conurbation that included Portsmouth, Dover, Somersworth, and Rochester (Company D). Company G was the only one in the regiment where the majority of men came from one town. To summarize, a very small group of towns contributed the great majority of men from urban areas, and these men filled just three out of ten companies.  

If anything, the picture presented by these men recruited from larger towns is one of movement and dynamism. 

  • 8% (41) came from out of state
  • 6% (31) had been born in a small town but moved to an urban area
  • 5% (28) lived in the urban area where they’d been born
  • 4% (21) were foreign born and had immigrated to an urban area (the majority of these were Europeans—French Canadians tended to take up rural occupations)

A closer look at the two urban areas that contributed the most men to the 5th New Hampshire, however, shows the degree to which migration was really important.

Of the 540 men in the pool, 45 resided in Claremont in 1861. Of these:

  • only 12 were born in Claremont
  • 8 were born in other New Hampshire towns
  • 19 were born in other states (10 in Vermont, 6 in Massachusetts, 1 in New York, 1 in Connecticut, and 1 in Ohio)
  • 6 were born abroad (3 in Ireland, 1 in England, 1 in Germany, and 1 in Canada)

Of the men in the pool, 36 resided in Concord when they enlisted. Of these:

  • only 4 were born in Concord
  • 12 were born in other New Hampshire towns (3 of whom were born in urban areas—1 each in Keene, Rochester, and Manchester)
  • 11 were born in other states (7 in Vermont, 2 in New York, 1 in Massachusetts, and 1 in Maine)
  • 10 were born abroad (7 in Ireland, 2 in England, and 1 in Canada)

In both cases, men who had been born in New Hampshire constituted a minority.

Before I end this post, it bears mentioning that all these statistics relating to the 5th New Hampshire’s recruits do not capture one very important group whose migration influenced New Hampshire’s demography: the very large numbers of people fleeing the state. It bears repeating that in 1860, almost a third of the people who’d been born in New Hampshire no longer lived there. Had these people remained in the state, the population would have been almost 40% larger.

Why does all of this discussion of migration matter? We don’t think of New Hampshire as diverse in this period, and in many ways it really wasn’t. The great bulk of the population was white, native-born, and rural. A majority worked the land. But underneath all that, there were important differences.

The state was not static. People moved quite a bit. Even decayed rural towns appear to have witnessed constant turnover—some people left, and others took their places. Folks throughout New Hampshire were frequently brought into contact with people from elsewhere–other towns, other states, and, occasionally, even other countries. And nowhere was this more true than in New Hampshire’s urban areas. Even in Claremont, whose population barely exceeded 4,000, the majority of recruits produced for the 5th New Hampshire had either been born out of the state or out of the country. This diversity, of course, was not so significant as it was in more economically vibrant states. But it shows that even New Hampshire, for all its slow growth and apparent uniformity, participated in important national trends that shaped the rest of the country.


[i] Census of 1860, v. https://www2.census.gov/library/publications/decennial/1860/population/1860a-02.pdf

[ii] Census of 1860, xxxviii. https://www2.census.gov/library/publications/decennial/1860/population/1860a-02.pdf

[iii] Census of 1860, xxvii. https://www2.census.gov/library/publications/decennial/1860/population/1860a-02.pdf

[iv] Census of 1860, xxxvi. https://www2.census.gov/library/publications/decennial/1860/population/1860a-02.pdf; Census of 1860, xli. https://www2.census.gov/library/publications/decennial/1860/population/1860a-02.pdf

[v] Census of 1860, 304-305. https://www2.census.gov/library/publications/decennial/1860/population/1860a-24.pdf?#

[vi] Census of 1860, xvii. https://www2.census.gov/library/publications/decennial/1860/population/1860a-02.pdf

[vii] It’s important to note here that these proportions (male to female, percentage of military aged men, etc.) were unevenly distributed across the state. In Hillsborough and Strafford Counties, men were only 47% of the population while they constituted 53% of the population in Coos County. Men between the ages of 20 and 40 formed 13% of the population in Carroll and Sullivan Counties where they amounted to 18% of the population in Coos County. Coos then was the fastest-growing, youngest, most male county in New Hampshire—but it also had the smallest and most sparsely settled population.

[viii] https://www.census.gov/history/www/programs/geography/urban_and_rural_areas.html; https://www2.census.gov/geo/pdfs/reference/GARM/Ch12GARM.pdf

[ix] Census of 1860, 306-309. https://www2.census.gov/library/publications/decennial/1860/population/1860a-24.pdf?#

[x] https://en.wikipedia.org/wiki/Urbanization_in_the_United_States#cite_note-main-1

[xi] Census of 1860, xxxiii. https://www2.census.gov/library/publications/decennial/1860/population/1860a-02.pdf

[xii] Census of 1860, xxxi. https://www2.census.gov/library/publications/decennial/1860/population/1860a-02.pdf

[xiii] Rev. Stephen G. Abbott, The First Regiment New Hampshire Volunteers in the Great Rebellion (Keene: Sentinel Printing Company, 1890), 13.